Today’s lecture was pretty confusing, but I got the hang of it in the end. Professor Kolodka talked about solubility limits and how solubility limits change as a mixture is heated up. To visualize this concept, he introduced phase diagrams, which indicate phases of matter as a function of temperature, composition, and pressure. Below is a phase diagram of a sugar/water mixture:
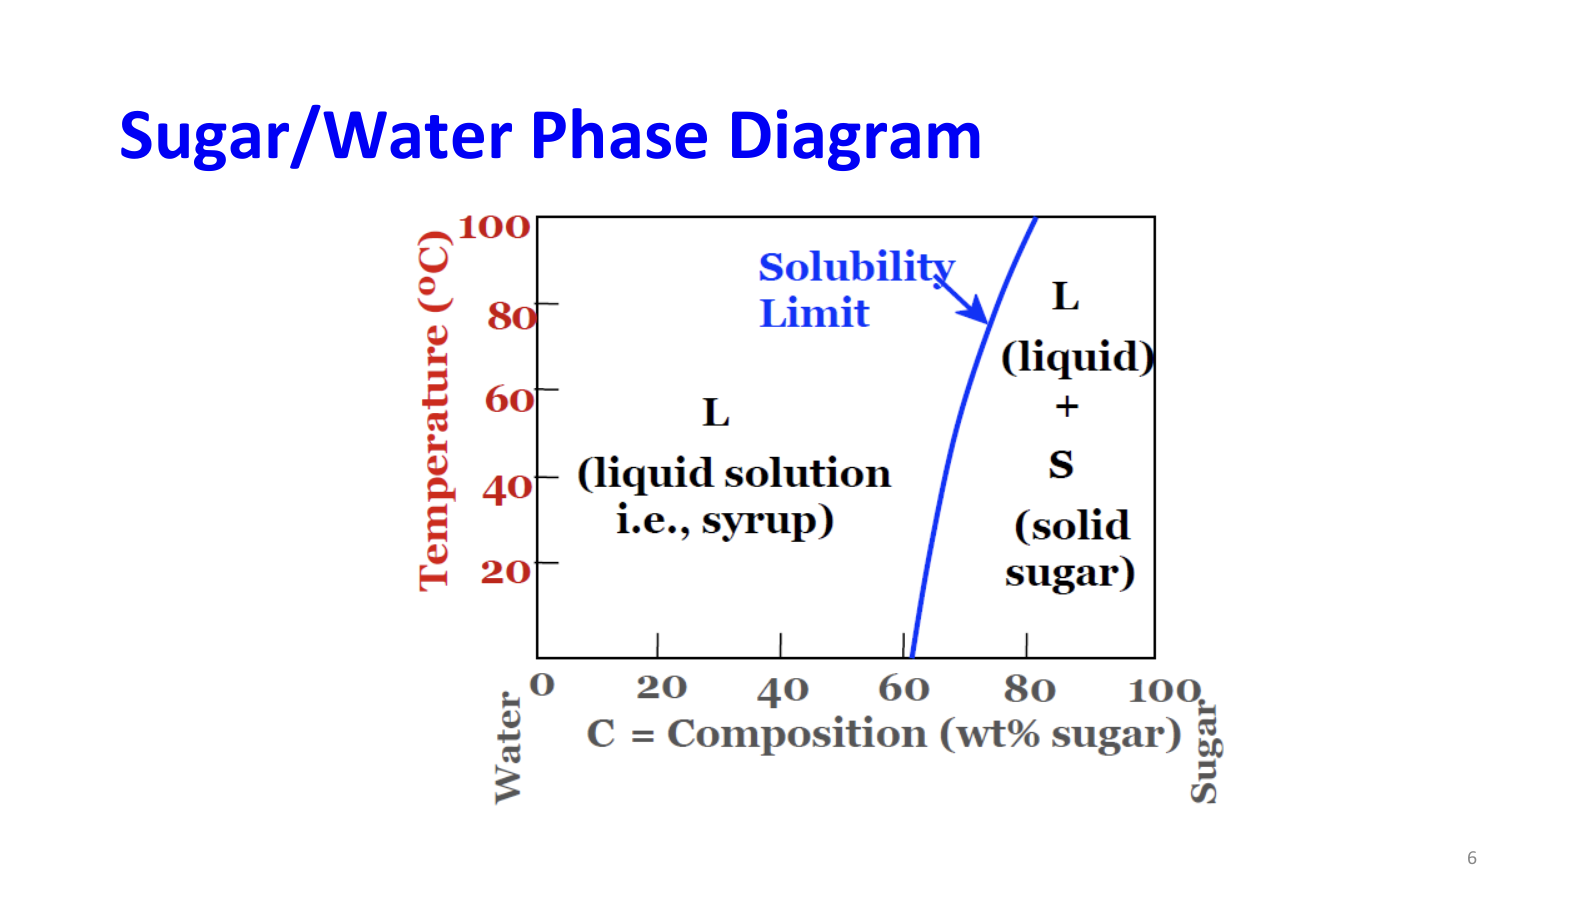
What the graph is essentially showing is the minimum temperature the solution has to be at for a certain sugar concentration to dissolve in the water, hence the area representing the single liquid phase being above the solubility limit and the combination of liquid and solid phases being below the solubility limit.
For combinations of different metals, the system can have three or more phases: one liquid phase, at least one solid phase, and a combination of the liquid phase and each of the solid phases. For example, a copper-nickel system has a liquid phase, a liquid + solid phase, and a solid phase. However, a copper-silver system has two solid phases, so it has two different liquid + solid phases as well. These phase diagrams can be used to calculate the percentage of weight of each phase for a given composition and temperature. Honestly, I still get confused by what the word “phase” refers to because we’ve used it to refer to so many different things just this week.
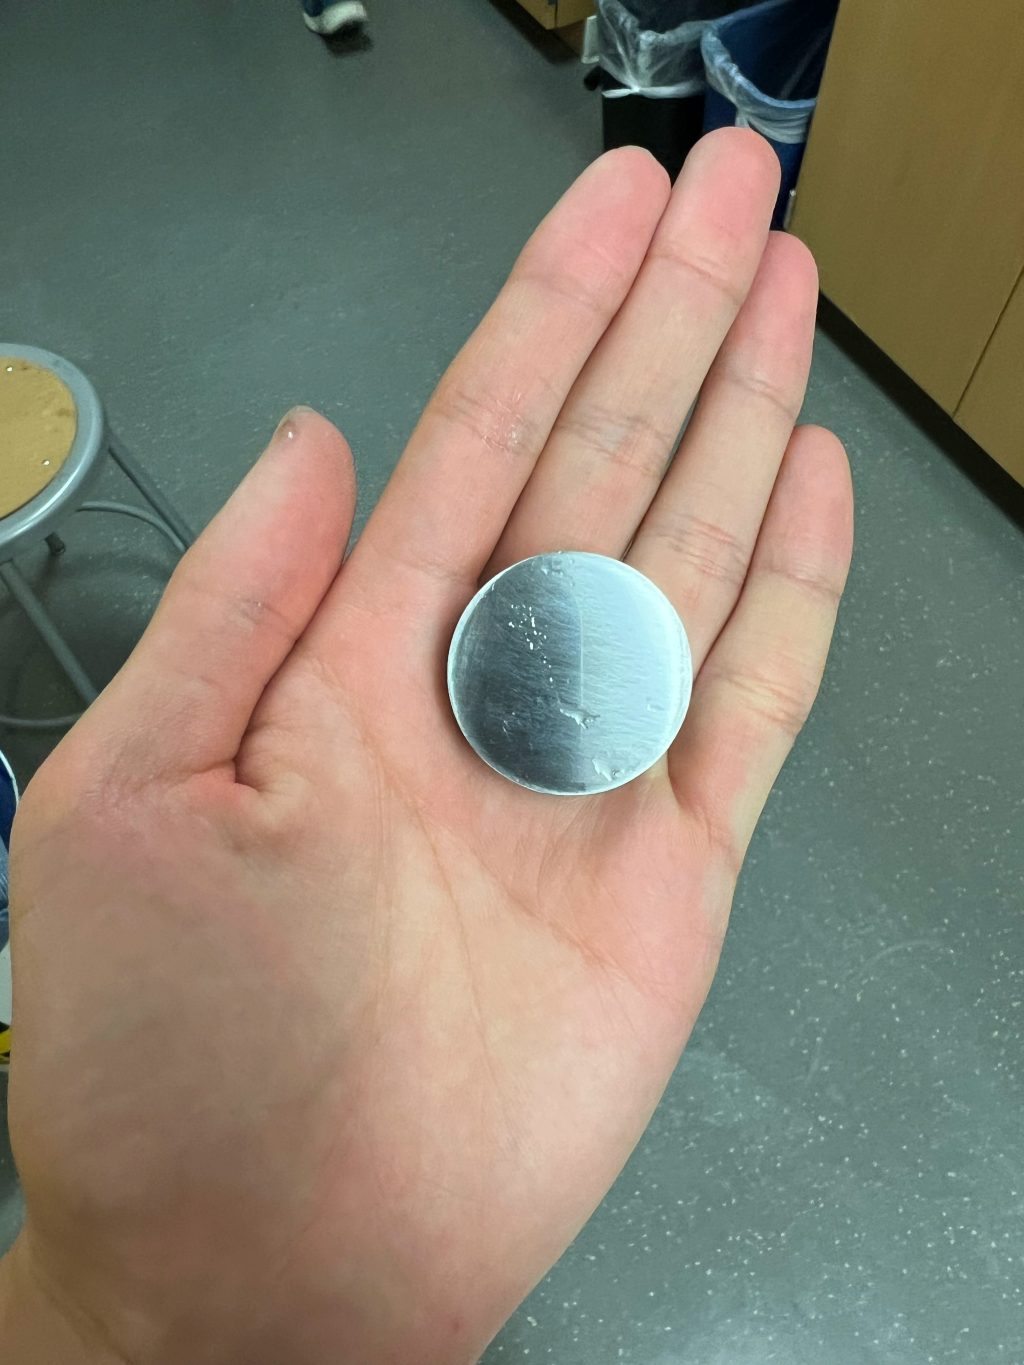
In the afternoon, we met our second professor, Elizabeth Nowadnick, who goes by Beth, and here research focuses on computational materials physics. Essentially, she uses supercomputers to run massive simulations of interactions between atoms. She led our lab for the day, which we will be continuing tomorrow, and she will also give us a lecture tomorrow on materials in electronics. Our lab today again involved steel samples, but this time we were testing the hardness of them after different heat treatments: some where austenitized, some where tempered, and some weren’t treated. My group was given an untreated sample and a tempered sample. Then, after collecting data using the hardness testing machine, we had to sand the samples until they were reflective.
According to our data, the tempered sample was twice as hard as the untreated sample, but I didn’t understand why that was. What about the heat treatment altered the characteristics of the steel that allowed it to become twice as hard as it originally was?


Leave a Reply